

Metrics matter to your peer-to-peer fundraising campaign. If you are going to be successful long term, your charity needs to understand (and react to) the fundraising trends of your participants. These trends reveal the fundraising health of your event. Are you recruiting participants who merely show up or fundraisers who raise cold, hard cash? Tracking these participant fundraising metrics will help you ensure your event grows an ever increasing culture of fundraising.
The #1 Metric Every P2P Fundraising Event Should Be Watching
No matter who you are, how big your charity is, or how successful your p2p fundraising events have been in the past, you need to monitor your “Participants Fundraising Percentage.” This metric tracks every participant who registers for your event and, depending on their activity, tags them into one of four categories:
- No Activity
- Self Donated (only)
- Fundraised (only)
- Self Donated and Fundraised.
If your event charges a registration fee (which we’d generally discourage given how it transactionalizes your participant relationship and weakens your culture of fundraising), then you’ll want to track that too. Categories might then include “Reg Fee Only,” “Reg Fee + Self Donated,” “Reg Fee, Self Donated + Fundraised.”
Why do these categories matter? What can they teach you? How will they inform your campaign? Let’s take a closer look:
No Activity
Participants who register and then do nothing are in this category. Every event has good folks like these so don’t be too put off. They may have sincerely intended to fundraise, but in the end, for whatever reason, they didn’t. If your event is family-friendly, then of course some of your “No Activity” participants could be toddlers or children who you wouldn’t necessarily expect to fundraise.
All that being said, you want as few people as possible in this category, but, depending on your event, it will likely never get to zero. Set a goal of having no more than 20% off your registered participants here and keep a close eye on which direction this category trends. Are your “No Activity” registrations going up or down? If your percentage is increasing (even after accounting for kids), you’ve likely got a problem. Take an honest look at the way you are recruiting – is there a clear expectation to fundraise? Look closely at your messaging and recruitment efforts – do you use the language of participation or fundraising?
A word about awareness. We all want to grow the awareness of our events, hard as it is to measure sometimes. But don’t let your awareness pursuit distract you from your fundraising purpose and be cautious you don’t trade fundraising failure for awareness success. Let awareness follow your successful fundraising event rather than lead it. A hugely successful fundraising event will satisfy your funding needs now and bring you all the buzz and momentum you desire to grow your charity later. Focus on fundraising success and the awareness you seek will find you.
Self Donated (Only)
Participants who have registered and donated to themselves, but who do not receive any other donations, are in this category. Again, maybe they intended to fundraise, but in the end they did not or could not bring in any other funds. The good news is they did put themselves out there financially and participated on event day. You can work with that effort. Any skin in the game is positive and some participants in this category give very generously.
Having a number of people in this category is not inherently bad, but don’t confuse them with fundraisers – at least not yet. Self-donating participants are really just donors who also participate. They have potential. If you can convert them to fundraisers they’ll be absolute gold for you. So watch how this metric is trending year over year – are more people self-donating than last year? How does this number compare to those who “Fundraised” or were in the “No Activity” category?
The relationship between these numbers will paint a different picture of your event’s long term success. If your number of “Self Donated” participants is going up while your number of “No Activity” participants is going down, that’s progress! But if your number of “Self Donated” participants is going up while your number of “Fundraised” or “Fundraised + Self Donated” participants is going down, your people are becoming disengaged, and that’s no bueno.
Regardless of the trend, always remember there is real potential to bump up the engagement in this group. With the right messaging, motivation, and management, you can move participants from “Self Donated” to “Fundraised + Self Donated.” Lean into a strong fundraising message, ensure captains are clear on their responsibilities, and share your momentum throughout the campaign. Note: some percentage of self donated registrants may be children whose parents donated on their behalf.
Fundraised (Only)
This category tracks participants who register and fundraise, whether $1 or $1,000, but who do not (or have not yet) donated to themselves. These folks are wonderful. A team captain has recruited them (or maybe they are a captain themselves) and they’ve done the work: setting up their personal fundraising page, posting pictures, sharing their story, and asking their friends and family for m-m-m-say-it-with-me-MONEY! They are the engine in your campaign and what’s great is they come in all age ranges. Kids, youth, teens, twenties, middle aged and beyond (where I reside) can all successfully find their way into this “Fundraised” category. The data shows that the wider your demographic of ages, the better your chances of hitting your fundraising goal.
As you monitor this metric, you want the number of “Fundraised” participants (and “Fundraised + Self Donated”) to always, always be trending upwards. If these numbers begin to drop, you need to act quickly and reorient your campaign to be focused on the fundraising first and the event second.
Fundraised + Self Donated
We saved the best for last. This category contains participants who register and self-donate and fundraise. They are the diamonds in your campaign. They are truly invested. They give to themselves, likely others as well, and fundraise with effort. These are often team captains, eager to recruit, and have nothing but positive things to say about your event (and they talk to a lot of people about your event!). It would be wise for you to get to know them. If they are this committed to your event they might make a great committee member or value becoming a long term organizational donor. The ultimate goal would be to have as many participants as possible in this category. As with your “Fundraised” folks, if the number of people in this category is trending downward, you need to act – fast!
Setting Targets For Your Event
Now that you know your categories, what should your target be for each? In a perfect world you’ve got only “Fundraised + Self Donated” participants, but if you’re like us, working in the family-friendly p2p event market, you’ll likely have a spread of all four categories.
Let’s take a closer look at the Participants Fundraising Percentage from our 2023 Coldest Night of the Year event. We had just over 5,900 captains and 37,500 participants. In the end, here’s where our four categories broke down for this event:
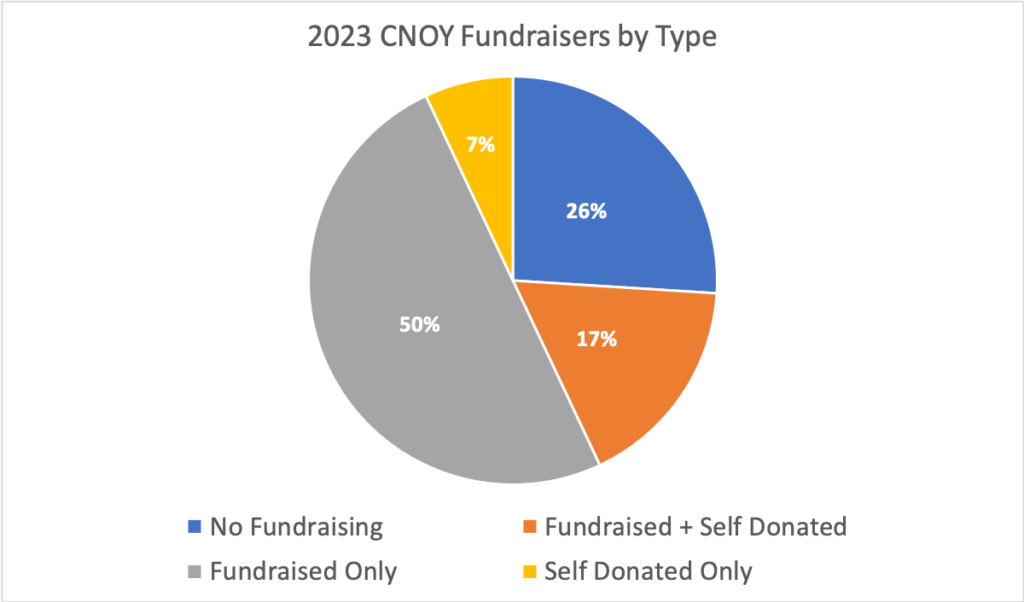
This is a great result. 74% of our participants were fundraising. We’re always trying to increase that figure – the struggle is real. The challenge for all of us in the p2p world is to watch our participant fundraising metrics closely.
Your own goal should be to have 50% or more of your participants in the “Fundraised” and/or “Fundraised + Self Donated” category. If your percentage is lower than 50%, we’d advise you to address it soon. There are some simple, achievable strategies to troubleshoot your event before it dies or worse, continues on life support while wasting time and resources. A few bold steps will turn your event around in one campaign – it all starts with monitoring the metrics.
Special: Blue Sea Foundation partners – you can track your participant fundraising percentage metrics easily by logging into waves and scrolling down your dashboard. Remember to navigate to each event year to track the trends.